FINDING OUT HOW ACCOUNTANTS WORK
Spenmo needed to understand how SME finance teams actually handle bill payments before making decisions on features, pricing, and positioning. I supported the design lead in running a structured research programme with accounting heads across 10 companies.
Context
Spenmo's leadership wanted detailed insight into how companies with 50 to 200 employees handle bill payments before committing to product and pricing decisions. The internal assumptions about how finance teams worked hadn't been validated with real users, and the stakes of getting it wrong were high: building features people valued but wouldn't pay for, or missing the workflows they actually cared about.
My design lead owned the research programme and its strategic framing. My contribution was in the execution: co-facilitating interview sessions, running the feature prioritisation activity, and synthesising findings.
Research Approach
Participants
The research targeted accounting heads and senior finance decision-makers at SMEs with 50 to 200 employees. This size range was deliberate: large enough to have dedicated finance workflows, small enough that those workflows hadn't been fully systematised.
- 10 in-person interviews conducted over 4 weeks
- Participants: accounting heads, senior finance decision-makers
- Company size: 50 to 200 FTE
Session Structure
Each session ran for 60 minutes, split into two parts to capture both qualitative insight and quantitative preference data, with a 5-minute buffer built in.
Part 1 (25 min) was a semi-structured interview covering day-to-day bill payment workflows, current tools, pain points, and the busiest periods in their accounting calendar.
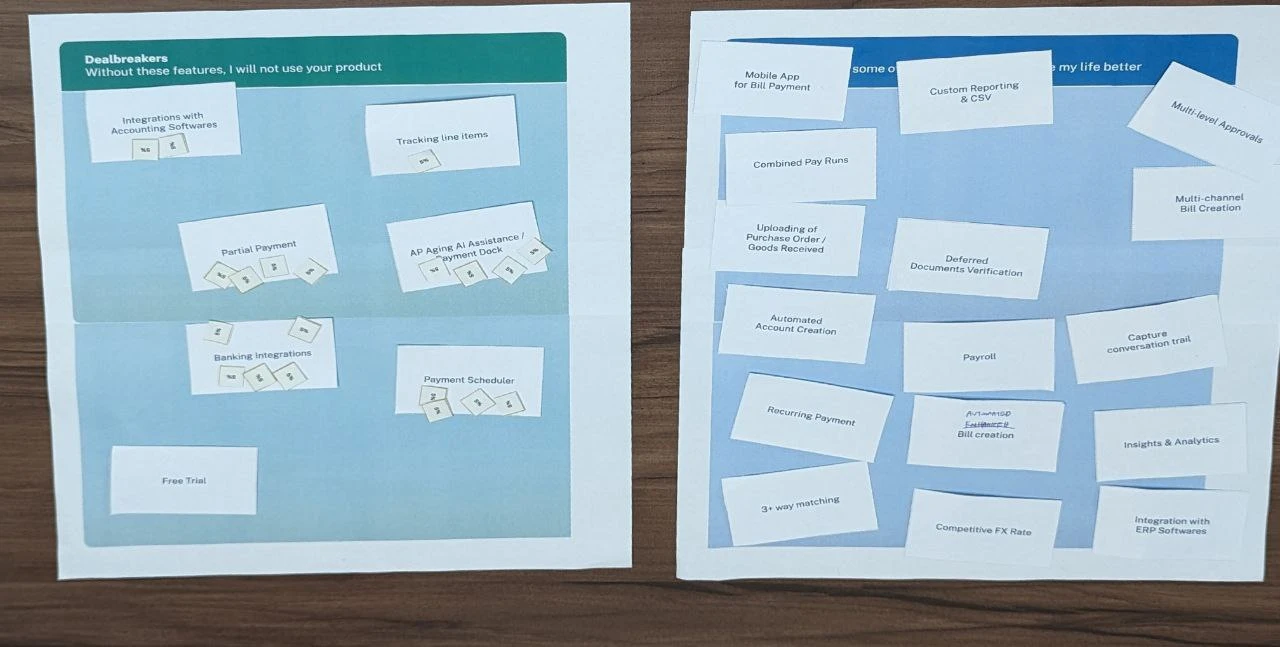
Part 2 (35 min) was a feature prioritisation activity. Participants ranked spend management features and allocated a hypothetical budget of 100 points across them, revealing how much they valued each feature relative to the others and where stated preferences diverged from actual willingness to pay.

Key Findings
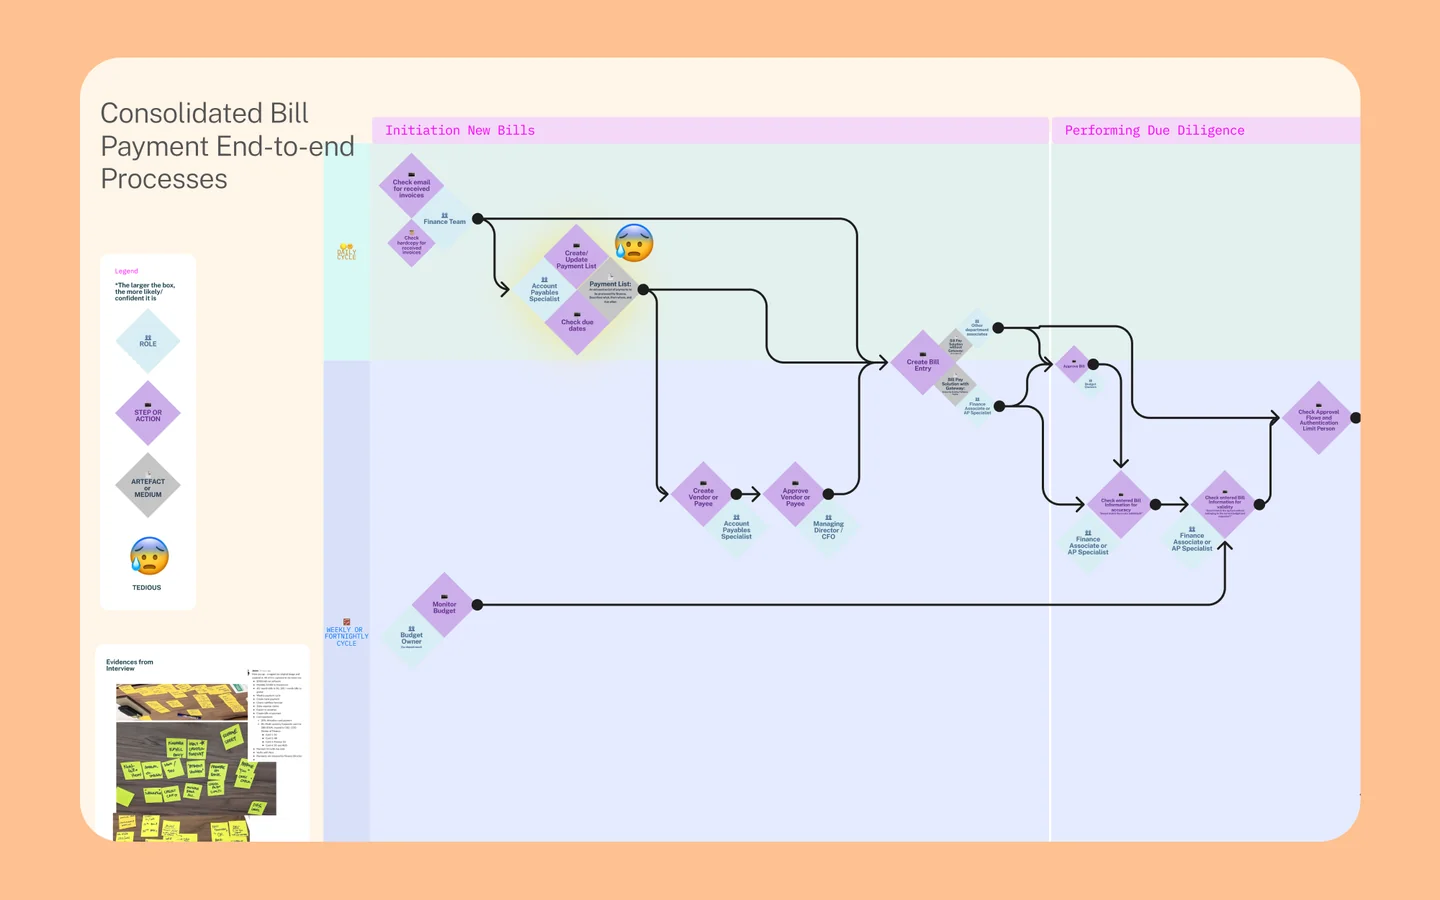
1. Workflows were more fragmented than assumed
We expected finance teams to use one or two primary tools for bill payments. Most were using three to five: a mix of Excel, accounting software, banking platforms, email, and in some cases physical records. There was no single source of truth, and switching between tools was a source of daily friction.
2. Creating the bill list was the biggest pain point
Across interviews, assembling the bill payment list each cycle was consistently identified as the most tedious part of the job. Participants were keen on anything that could automate or reduce the manual effort involved in this step.
3. Card avoidance was about control, not cost
Finance teams weren't avoiding card payments because of transaction fees. They avoided them because cards didn't give them enough control over timing and amounts. This reframed the product conversation: the solution wasn't to reduce fees, it was to offer more control.
4. Spreadsheet attachment was emotional, not just habitual
Despite wanting better workflow tools, participants resisted the idea of retiring their spreadsheets. Years of customisation had created institutional knowledge that felt irreplaceable. Any product positioning that framed itself as a spreadsheet replacement was likely to generate resistance, not enthusiasm.
Strategic Implications
The findings were compiled by the design lead and presented to Spenmo's management to inform decisions on feature prioritisation, pricing strategy, and product positioning. I left before seeing the final outcomes, but the research pointed clearly toward three directions:
- A payment scheduler to automate the most manual step in the finance workflow
- Banking integrations to give teams the control over transaction timing they were missing from card payments
- Accounting software integrations to bridge the gap without asking teams to abandon their spreadsheets
On positioning: framing Spenmo as a workflow enhancement rather than a spreadsheet replacement would reduce adoption friction by working with existing behaviour rather than against it.
Reflections
Stated preferences and revealed preferences diverge
What accountants said they valued in interviews didn't always match what they allocated budget to in the prioritisation activity. Convenience features were popular in conversation; compliance and control features got the budget. Building research methods that capture both gives you a more honest picture than interviews alone.
Emotional attachment is a product constraint
The spreadsheet finding was the most useful insight from the research, and the easiest one to dismiss as irrational. Treating it as a real constraint instead of an obstacle to overcome changed how the team thought about positioning. Users don't adopt products that make them feel like their existing work was wrong.
On being a contributor rather than a lead
Working in a supporting role on this project gave me a clear view of what structured research looks like at a strategic level — how to design a session that captures both qualitative and quantitative signal, and how to frame findings for a non-design audience. That framing work, turning raw interview observations into decisions leadership could act on, was as important as the research itself.